Friday 28 November 2014

Infographic: Permanent Magnet Market Will Reach USD 28.70 Billion in 2019


Permanent Magnet Market

A New Report Published by Transparency Market Research “ Global Permanent Magnets Market - Forecast, Market Share, Size, Growth and Industry Analysis, 2013 - 2019, “ the global demand for permanent magnets was valued at USD 15.32 billion in 2012 and is expected to reach USD 28.70 billion in 2019, growing at a CAGR of 9.5% from 2013 to 2019. In terms of volume, the demand was 650.0 kilo tons in 2012 and is expected to be 1,168.7 kilo tons in 2019, growing at a CAGR of 8.8% from 2013 to 2019.

Browse full Permanent Magnets Market Report Press Release: http://www.transparencymarketresearch.com/pressrelease/permanent-magnet-market.htm


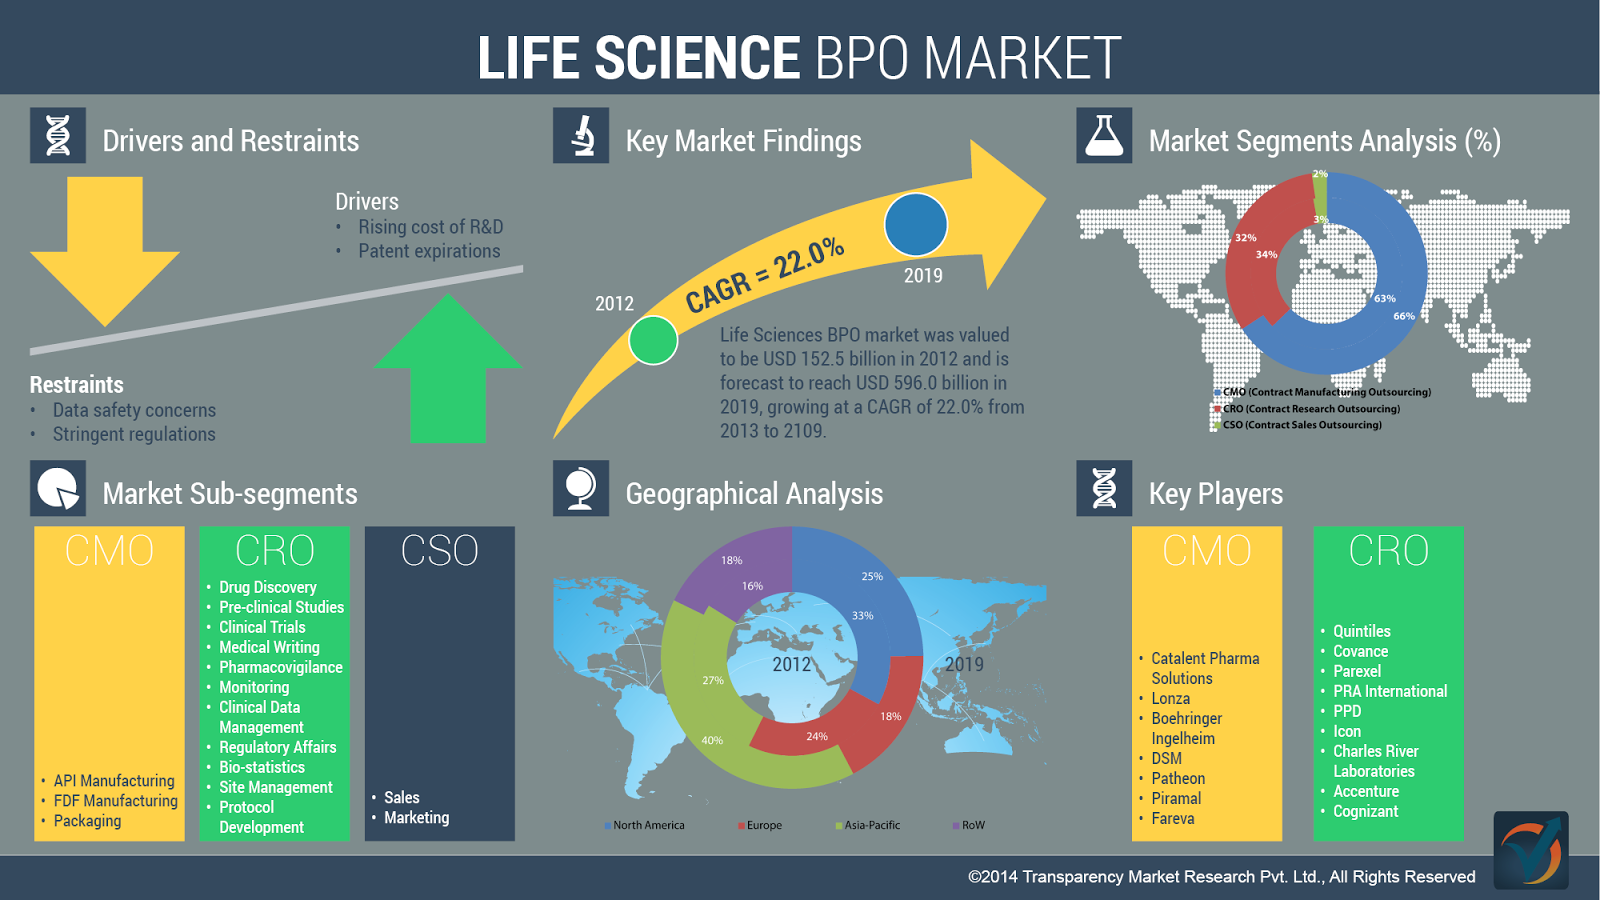
Infographic: Global Life Sciences BPO Market to be Worth USD 596 Billion by 2019

Life Sciences BPO Market

The latest addition to the market research report database of Transparency Market Research is a report on the dynamic Life Sciences BPO market. The new report-titled Life Sciences BPO Market [Contract Research Organizations (Drug Discovery, Pre-Clinical, Clinical Trials, Medical Writing, Pharmacovigilance, Risk-Based Monitoring, Clinical Data Management, Biostatistics) and Contract Manufacturing Organizations]- Global Industry Analysis, Size, Share, Growth, Trends and Forecast, 2013 – 2019-analyzes the core factors influencing this market and potential growth areas as well as restraints besides profiling leading market players in this sector. 

According to the report, the global market for Life Sciences business process outsourcing (BPO) was worth USD 152.5 billion in 2012, and expert analysts from the firm predict through in-depth analyses that the market will likely be worth USD 596.0 billion by 2019, demonstrating a healthy compounded annual growth rate (CAGR) of 21.5% between 2013 and 2019.

Browse full Life Sciences business process outsourcing Market Report Press Release: http://www.transparencymarketresearch.com/pressrelease/life-sciences-bpo-market.htm

Thursday 27 November 2014

Infographic: Defibrillators Market is Expected to Reach USD 14.2 Billion Globally in 2019

Defibrillators Market

According to a new market report published by Transparency Market Research "Defibrillators Market (Advanced Life Support, Automated External Defibrillators, Implantable Cardioverter Defibrillators, Wearable Defibrillators)- Global Industry Analysis, Size, Share, Growth, Trends and Forecast, 2013 - 2019," the global defibrillators market was valued at USD 9.3 billion in 2012 and is expected to grow at a CAGR of 6.2% from 2013 to 2019, to reach an estimated value of USD 14.2billion in 2019.


Infographic: Global In Vitro Diagnostics Market will Reach US$174.2 million by 2018

In Vitro Diagnostics Market

Transparency Market Research, in its latest research report states, the global in vitro diagnostics market will grow significantly in the coming years. The global in vitro diagnostics market was valued at USD 46.0 billion in 2011. However, it is expected to reach USD 74.2 billion by 2018, growing at a CAGR of 7.1% from 2012 to 2018. The report “In Vitro Diagnostics Market (Clinical Chemistry, Immunoassay, Diabetes Testing, Blood Testing, Molecular Diagnostics) - Global Industry Analysis, Size, Share, Growth and Forecast, 2012 – 2018” is available for sale on the company’s website.

Read Press Release of In Vitro Diagnostics Market is Expected to Reach USD 74.2 Billion Globally in 2018: http://www.tmrblog.com/2014/01/in-vitro-diagnostics-market-is-expected.html

Wednesday 26 November 2014

Infographic: Global Polyurethane Dispersions Demand Is Expected to Reach 369.3 Kilo Tons by 2018

Polyurethane Dispersions Market

Transparency Market Research has released a new market report titled "Polyurethane (PU) Dispersions (Aqueous and Solvent) Market for Textiles, Natural Leather Finishing, Synthetic Leather Production and Other Applications- Global Industry Analysis, Size, Share, Growth, Trends and Forecast, 2012 - 2018," which observes that the global polyurethane dispersions market demand in 2012 was 267.1 kilo tons and is expected to reach 369.3 kilo tons by 2018, growing at a CAGR of 5.5% from 2012 and 2018. In terms of revenue, the market is expected to reach USD 1.18 billion in 2018, growing at a CAGR of 7.5% from 2012 to 2018.

Infographic: Global Commercial Satellite Imaging Market to Grow at 13.9% CAGR from 2013 to 2019

Commercial Satellite Imaging Market

According to a research report on the global commercial satellite imaging market published by Transparency Market Research (TMR), the commercial satellite imaging market is expected to attain market value worth US$ 5,018.6 million by 2019. This market valued nearly US$2,054.5 million in 2012, and is forecast to grow at a CAGR of 13.9% from 2013-2019. TMR analysts state that the market is currently benefitting from growing demand from the fields of oil and gas and natural resource management. Rising demands from commercial applications such as city planning, fleet management, real estate and insurance could also benefit the global satellite imaging market in the long-run, states the report.

Browse full Commercial Satellite Imaging Industry Analysis and Market Forecast  Press Release at http://www.transparencymarketresearch.com/pressrelease/commercial-satellite-imaging-market.htm

Tuesday 25 November 2014

Global LTE Market to be Worth $610.71 billion by 2019: Transparency Market Research

LTE Market

The global LTE market is expected to be worth $610.71 billion by 2019, with a CAGR of 78.6% from 2013 through 2019. These are the findings of a market report published by Transparency Market Research, a U.S.-based market intelligence firm. The report is titled “Global LTE Market - Global Industry Analysis, Size, Share, Growth, Trends and Forecast, 2013 - 2019”.

Long Term Evolution (LTE), mainly marketed as 4G LTE, is a wireless communication technology that reduces the cost per gigabyte with capacity per site. The need for this technology is driven by aspects such as increased data usage, growing needs for greater spectral efficiency and higher data rates, high deployments of smart technology devices, and the basic need for high quality of services. Such are the important reasons driving the growth of the LTE market across the globe. The market is also fuelled by increased adoption of large-scale adoption of LTE and public safety by operators, especially in Asia Pacific. 

Physical Security Market to Reach US$125.03 Billion by 2019: Transparency Market Research

Physical Security Market


A market research report published by Transparency Market Research estimates that the global physical security market is expected to reach $125.03 billion by 2019, growing at a CAGR of 14.9% from 2013 to 2019. These findings are published in report titled “Physical Security Market (Hardware, Software and Services) - Global Industry Analysis, Size, Share, Growth, Trends and Forecast, 2013 – 2019”.

The overall physical security services market is segmented into remote management services, video surveillance as a service (VSaaS), security consulting, public alert, customer information, technical support, public safety answering point (PSAP), and warning systems and others. However, the VSaaS market is estimated to rise at a CAGR of 28.8% during the forecast period and reach market size of $2.42 billion by 2019.

Browse full Physical Security Market research report with complete TOC at http://www.transparencymarketresearch.com/physical-security-market.html

Sunday 23 November 2014

Saudi Arabia Food and Beverage Sector Set to Reach SR262.5 billion Annually


Foodex Saudi, an event that will see over 400 food and beverage brands from 30 countries in participation, took off this week at Jeddah. The event will likely see over 15,000 attendees, most of them buyers and visitors from the GCC region and Saudi Arabia. Prince Khalid bin Saud bin Khalid bin Turki Al-Saud, Saudi Arabia’s Meteorology and Environmental Protection Technical Affairs deputy chairman, inaugurated the event.

Speaking on the occasion, who is at the helm of the exhibition Simon Blazeby said that the food sector in Saudi Arabia is projected to see 55.3% growth in the near future, reaching an estimated SR262.5 billion annually. Blazeby said that Saudi Arabia’s agricultural and food commodities alone constitute about 15 % (amounting to SR65.5 billion) of the Kingdom’s imports. Market experts project that agricultural imports by the country are expected to register a 76% increase by 2016.

This exhibition was conceptualized as a platform where companies and brands from both domestic and international markets could come together under one roof to help develop the overall food and beverage sector in Saudi Arabia.

Among the various sections that find exposure in the exhibition are – organic food, health food, baked goods, poultry, seafood, meat and game, ready-to-eat as well as frozen foods, and companies engaged in food packaging and food technology.

The inaugural function also saw the launch of the Saudi Food Forum, a three-day event that will cover discussions on a variety of topics such as supply chain logistics, food safety and security, export and import opportunities, food marketing, and halal food benchmarks.

Friday 21 November 2014

North America Milk Market to Hit USD 29.1bn by 2019: Transparency Market Research


The milk market in North America is projected to register a CAGR of 3.5% to reach US$29.1 billion by 2019, says a latest market research report published by Transparency Market Research (TMR). The U.S.-based market intelligence firm says in its report that the North America milk market stood at US$ 27.81billion in 2012. The report is titled ‘Milk Market - North America Scenario, Industry Analysis, Size, Share, Growth, Trends, and Forecast, 2013 – 2019’.

According to TMR, the growth of the North America milk market is largely supported by a strong milk distribution network that ensures the easy availability of milk in retail stores. Consumers are increasingly wary of the nutritional value of food products that they consume, making milk one of the preferred sources of nutrition, especially calcium. The milk market in North America is also expected to be buoyed by a change in eating patterns among consumers in this region. Since 2011, the popularity of dairy products as an integral part of dietary plans has contributed to a higher consumption of milk here. The demand for this dairy product has been on the rise also owing to a growing immigrant population in the United States and Canada. As more immigrants, their families, and children move to the U.S. and Canada, the demand for dairy products, especially milk, has been rising over the past few years.

TMR’s report on the North America milk market segments the industry based on product type as: butter milk, concentrated milk, liquid milk, and powder milk. The report studies three main countries – U.S., Canada, and Mexico – to determine and forecast demand and revenues based on product type.

Within the product segment, concentrated milk is estimated to register the fastest growth. The growth rate of the concentrated milk segment is pegged at 3.47% through the next six years. Another segment that will show healthy growth is that of liquid milk. An expansion in this segment will primarily arise from an increasing awareness about meeting daily nutritional requirements and an improved overall awareness about health. An ever-increasing network of hypermarkets and supermarkets, resulting from stronger distribution channels, is giving consumers easier access to milk at lower prices. This factor can also be regarded as a growth driver in the North America milk market.

Browse the full report of North America Milk Market, here: 

The report anticipates private labels to lead in terms of market share, over the next six years. Private labels are not only cost effective, but also provide high-quality milk to consumers in North America. After private labels, the largest share in the milk market in North America was occupied by dairy farmers in 2013. TMR’s report profiles leading market players in the North America milk industry such as: Parmalat, Dairy Land, Neilson, and GrupoLala. The study offers incisive insights into current North America milk market trends and provides market forecasts from 2013 through 2019.

British Grocery Sales Slide for Three Consecutive Months, First Such Dip in 20 Years: Study


Latest industry data published this week shows that the grocery market in Britain has, for the first time in the last 20 years, witnessed three consecutive months of decline in sales. With the impending Christmas season, this only adds to the pressure being experienced by the league of four major players in the UK consumer goods market.

The data was published by Kantar Worldpanel. Grocery sales in the UK dipped 0.2% YoY, reaching GBP 24.88 billion. The figures relate to the first 12 weeks up to November 9, 2014. Since Kantar started recording market figures in 1994, this is the first decline in this market.

With a mounting price war, two emerging players in the grocery market – Aldi and Lidl – have earned healthy growth rates as compared to the bigger players despite having relatively smaller shares in the market. The report stated that while Aldi’s sales increased by 25.5%, Lidl saw a rise of 16.8%.

These two discounters have been fast eating into the shares of the big four – Tesco, Asda, Sainsbury and Morrison. While all four players are trying to compete by slashing prices, thus far it is only Asda that has been successful in reducing the flow of customers to the emerging discounters.

According to a senior official at Kantar Worldpanel, the price wars have benefited customers, who now pay up to 0.4% less for an average purchase of daily essentials such as milk, vegetables and bread, as compared to last year at the same time. The report forecasts that this price deflation would likely continue into 2015.

Wednesday 19 November 2014

U.S. Manufacturing Output Shows Modest Rise in October 2014 on Account of Dip in Automobile Output


According to the latest U.S. manufacturing output figures, a modest rise has been observed in the output in October 2014. This is being pinpointed to a dip in vehicle production for the third month straight. This also indicates sluggishness in economic growth as the fourth quarter of the year kicks in.

However, the figures state that the overall growth remains sturdy, as other data published this week show that New York state is witnessing a rebound in production and manufacturing activity this month.

According to a senior economist working with a New York-based research firm, the overall outlook for the U.S. economy continues to remain solid. However, there are a few risks that may affect growth in the third quarter of 2014.

The Federal Reserve said that factory production saw a 0.2% rise in October 2014, whereas the factory output for September 2014 was revised to 0.2% from 0.5%.

In the third quarter, the U.S. economy showed a 3.5% rate of growth. Economists opined that it was largely a result of a 1.2% fall in automobile production that caused this dip in output in October 2014. The total slide in automobile output was pegged at 1.9% in September 2014. Besides automobiles, there was also a drop in production volumes of electrical equipment, appliances, nonmetallic mineral products, and other components.

In another report, the NY Federal Reserve stated that there has been a rise in its Empire State general business conditions index. The index jumped from 6.17 in October 2014 to 10.16 in November 2014. The reading—when higher than zero—shows expansion.

Tuesday 18 November 2014

Electric Vehicles (on-road) Market to Reach 64.4 million units by 2019: Transparency Market Research


According to a new market report published by Transparency Market Research “Electric vehicles (on-road) (hybrid, plug-in, and battery) market – Global Industry Analysis, Size, Share, Growth, Trends and Forecast, 2013 – 2019,” the global on-road electric vehicles market is forecast to record 64.4 million units volume sales by 2019. In terms of revenue, it is expected to reach a value of USD 271.67 billion by 2019, growing at a CAGR of 19.2% from 2013 to 2019. Increasing use of electric vehicles is due to rise in gasoline prices, growing environmental concerns, and government support/initiatives such as tax exemptions to promote use of eco-friendly products and services. Worldwide, governments are dedicatedly funding research and development centres to develop efficient lithium-ion batteries which are used in electric vehicles. These advanced batteries offer improved energy transfer and better storage capacity at affordable cost. Regions such as Europe and North America are the pioneers in developing and adopting such technologies, with certain countries namely China, Japan, and South Korea, in Asia-Pacific region too, fast catching the trend.

The global on-road electric vehicles market has been classified by product types into four broad segments namely motorcycles and scooters, cars, buses, and others (neighborhood electric vehicles, bicycles, golf carts and trucks). In terms of revenue, electric cars dominated the market in 2012 with 19.6% of global market revenue. Others (neighborhood electric vehicles, bicycles, golf carts and trucks) segment is the second largest market and contributed 28.5% of market revenue share in 2012.  By volume, electric bicycles covered the largest market share and the segment is expected to continue its dominance throughout the forecast period.

Geographically, North America dominated the on-road electric vehicles market in 2012 and is expected to retain its dominant position during the forecast period. This is due to several government initiatives for promoting the adoption of electric vehicles in North America. For instance, U.S. government is taking initiatives to reduce the dependency on fossil fuels. Stronger efficiency standards and the higher taxes on motor fuels are steps in this direction further supporting the growth of electric vehicles in this region. Several national-level programs and initiatives such as research and development support, tax incentives, subsidies for electric vehicles purchasers, and public education programs, across Asia-Pacific region, are spreading awareness of electric vehicles. European government is also supporting, green technologies in automotive sector  so as to encourage electric vehicle sales. For instance, Brussels (Germany) has allotted EUR 5 billion for European Green Cars Initiative (EGCI), announced in 2008. Similar investments are being made by other major economies of the world, such as China with USD 15 billion and U.S. with USD 2.4 billion for electric vehicles.

 Nissan Motors, General Motors, Tesla Motors, Honda Motors Co. and Toyota Motors are some of the leading players in this market. These players collectively accounted for more than 50% of total market share in 2012. The electric vehicles market is expected to witness the emergence of new models at local and global level. For example, BMW i3, Cadillac ELR, Mitsubishi Outlander are few models that would be launched in 2014.

Browse the full Electric vehicles (on-road) (hybrid, plug-in, and battery) market – Global Industry Analysis, Size, Share, Growth, Trends and Forecast, 2013 – 2019:  
http://www.transparencymarketresearch.com/electric-vehicles-market.html

This report analyzes the electric vehicles (on-road) market in terms of revenue (USD million) and volume (million units). The market has been segmented as follows:

Electric Vehicles (on-road) Industry Application Market, By Product types
  • Electric Cars
  • Hybrid electric cars
  • Plug-in hybrid electric cars
  • Battery electric cars
  • Electric motorcycles and scooters
  • Hybrid electric motorcycles
  • Plug-in hybrid electric motorcycles
  • Battery electric motorcycles
  • Electric Buses
  • Hybrid electric buses
  • Battery electric buses
  • Fuel cells electric buses
Electric Vehicles (on-road) Industry Application Market, By Geography
  • North America
  • Europe
  • Asia-Pacific
  • Rest of the World (RoW)

Oppex, a Search Engine for Public Sector Tenders, Officially Launched


According to estimates, the public sector accounts for nearly 10-20% of the world’s GDP. While there are projects and opportunities aplenty in the public sector, making headway into the bureaucratic red tape isn’t an easy task for many companies. A search engine designed especially for public sector tendering is out to change that. The portal, called Oppex, has been officially launched this week by a team of Helsinki-based professionals. With the launch comes the announcement of US$1.5 million by way of seed funding, which is being invested by multiple companies.

The companies investing in Oppex are: Alma Media (a media company), Veturi (a startup accelerator), Tekes (a Finnish fund), and seven angel investors.
Speaking of the idea behind this portal, CEO of Oppex, Ville Heinonen, said that the public sector has massive sales opportunities that aren’t even known to a number of companies.

Heinonen said that companies often fail to bid for promising public sector projects even in their home countries, because of this lack of awareness. Needless to say, cross-border deals are even harder to negotiate. This is where Oppex hopes to bring about change by helping companies find new businesses and earn higher revenue from projects that exist in the public sector worldwide.

The portal allows companies to search for tenders and sales opportunities. In addition to this, the portal also comprises a database of public sector tenders that is updated continuously. According to the latest figures, the search engine had about 3.5 million listed tenders for the public sector. All of these tenders are translated into English, using specially-designed software. This, the company feels, will open up many new opportunities for companies located across the world.

Thursday 13 November 2014

Archer Daniels Midland Company Officially Opens Sweetener Manufacturing Facility in Tianjin, China


Archer Daniels Midland Company ADM has officially inaugurated a new facility dedicated to sweetener manufacturing within its integrated food manufacturing complex at Tianjin, a port city located in North China. The opening was marked by a ribbon cutting ceremony in the presence of the company’s key officials.

The complex is slated to be completed in 2015, and will be the company’s first fully owned and run production facility dedicated to food manufacturing in China. This manufacturing unit will also carry capabilities to manufacture soluble fiber – an important ingredient that is used for adding dietary fiber to an increasing number of foods and beverages today.

Both of these new production lines will prove critical to the company’s operations as the demand for these is growing stronger. The company’s APAC president, Ismael Roig said that the ADM recognizes its customers’ need for top-quality products that can be sourced from a reliable partner.

According to Roig, the company is investing heavily in high-growth economies such as China with the intention to reduce volatility in earnings and to scale up returns. In addition, ADM reckons that the facility will help the company meet China’s need for sustainable food supply from a reputable source. These needs have been given priority in the fifth 12-year plan laid down by China.

The ADM official said that Tianjin, being strategically located, provides easy access to both water and rail transportation, which will make raw material supply a seamless process.

ADM’s China operations were launched in 1995, with the acquisition of a plant manufacturing animal feed premix in the northeast province of Dalian.

Wednesday 12 November 2014

Microscopy Devices Market Expected to Reach USD 9.69 Billion Globally in 2020

According to a new market report published by Transparency Market Research “Microscopy Devices Market [Products (Optical Microscopes, Electron Microscopes, Scanning Probe Microscopes and Others) and Applications (Semiconductors, Life Sciences, Nanotechnology, Material Sciences and Others)] is Expected to Reach USD 9.69 Billion Globally in 2020: Transparency Market Research - Global Industry Analysis, Size, Share, Growth, Trends and Forecast, 2014 - 2020,” the global microscopy devices market was valued at USD 5.75 billion in 2014 and is estimated to reach a market worth USD 9.69 billion in 2020 at a CAGR of 7.6% from 2014 to 2020.

Microscopy devices are being used since the past three centuries. Discovery of microorganisms and the intricacies of an atom made humans more curious to understand the dynamics of the smaller worlds. This lead to the innovations in microscopy devices and thereby enriched us with the knowledge of the microscopic universe. From the simple hand-held magnifying lens, to the large Hadron Collider located in the Alps, created specifically to study the intricate details of the atomic substructures, microscopes have evolved in a great progression over the years. Devices have grown more complex and nowadays seldom use visible light in magnification of objects. Among them, the innovation of electron microscopy was a great boost to the microscopy segment. After exhaustive research and innovations in optical microscopy, focus on electron microscopy opened new frontiers.

The microscopy devices market is broadly classified on the basis of product segments and application areas. Among various product segments, the optical microscopes market accounted to have the largest market share of 38.9% in 2013. This is probably because it is among the oldest segments of microscopy in sales. Besides optical, there are electron microscopes, scanning probe microscopes and other customized hybrids, arranged in decreasing order of their shares in global microscopes revenues. Among various application areas, the life sciences industry segment accounted for the largest market share in 2013 and growing at a CAGR of 6.4% during the forecast period of 2014 to 2020. Semiconductors and material sciences segments follow the market for lifesciences segment. However, the market for nanotechnology segment is expected to display an impressive CAGR of 12.4% during the forecast period.

Geographically, Asia-Pacific region accounted for the largest share of global microscopy devices market in 2013, followed by North America. The Asian-Pacific region is expected to represent the highest growth rate of 9.1% during the forecast period. The major contributing factor for such dominance of the Asia-Pacific region is growing investment in research and development in these regions by the respective governments of Asia. China for example is at present the world’s second largest investor in research and development according to World Bank data. This along with presence of numerous schools, universities and research institutions would translate to greater growth in the coming years for the Asia-Pacific markets.

The major players of this market include Leica Microsystems, Olympus Corporation, JEOL Limited, FEI Company, Danish Micro Engineering A/S, Hitachi High-Technology Corporation, Cameca SAS, Bruker Corporation, Carl Zeiss AG, NT-MDT and Nikon Corporation to name a few.

Browse the full Global Microscopy Devices Market reports:  

The global Microscopy devices market is segmented as below:

Global Microscopy Devices Market, by Product
  • Optical Microscopes
  • Inverted Microscopes
  • Stereo Microscopes
  • Phase contrast Microscopes
  • Fluorescence Microscopes
  • Confocal Scanning Microscopes
  • Near Field Scanning Microscopes
  • Electron Microscopes
  • Transmission Electron Microscopes (TEM)
  • Scanning Electron Microscopes (SEM)
  • Scanning Probe Microscopes
  • Atomic Force Microscope (AFM)
  • Scanning Tunneling Microscopes (STM)
  • Others

Global Microscope Devices Market, by Application
  • Semiconductors
  • Life Sciences
  • Material Sciences
  • Nanotechnology
  • Others

Global Microscopy Devices Market, by Geography
  • North America
  • Europe
  • Asia-Pacific
  • Rest of the World (RoW)

November 11 Singles’ Day Shopping Fiesta: Alibaba Reports Sales of US$9.3 billion


Chinese E-commerce giant Alibaba, which pioneered the concept of mega sales on Singles’ Day (as an anti-Valentine’s day concept) in China, reported sales of over US$9 billion on November 11 this year.

According to reports, shoppers looking to celebrate the day and take advantage of the massive discounts on offer, purchased goods to the tune of US$9.3 billion. This illustrates the increasing power of Chinese consumers and also reiterates that Singles’ Day is a landmark event in the retail calendar.

Alibaba said that in the very first hour of trading, it sold goods to the tune of US$2 billion, of which US$1 billion worth of goods were sold in 18 minutes of the sale opening. November 11, celebrated widely across China, was reportedly created by university students as an anti-Valentine’s day for single people. It has been celebrated since 1993.
Executive vice chairman of Alibaba, Joe Tsai said that this event was reflective of the true unleashing of the power that Chinese consumers wield today.

Last year, the online shopping market in China surpassed that of the United States, to becoming the leading market in the world. This year, the build up to the event was much stronger, with participating merchants advertising their discounted prices from October 15. The pre-sales initiative is being credited for creating substantial hype, fuelling purchases this year.

According to Alibaba, this year’s festival has been truly global in nature, and has reached shoppers in over 200 countries.

Tuesday 11 November 2014

U.S. Quick Service Restaurant (QSR) Ecosystem Market Expected to Reach USD 7,324.2 Million in 2019


According to a new market report published by Transparency Market Research “U.S. Quick Service Restaurant (QSR) Ecosystem Market (Digital Signage, Kiosks, Drive through terminals, Point of Sales, Handheld devices, Digital menu cards) - Industry Analysis, Size, Share, Growth, Trends and Forecast, 2013 - 2019” the QSR ecosystem market in the U.S. was valued at USD 3,506.9 million in 2012. The market, on the basis of components, is segmented into hardware, software and services, with hardware and software solutions further segmented into various sub-segments. Within hardware components, digital signage was the largest contributor and accounted for 45.6% of the overall hardware segment revenue in 2012. However, kiosk is expected to be the fastest growing segment during the forecast period, growing at a CAGR of 12.3% from 2013 to 2019. This is mainly due to increasing demand for self service options. Within the software segment, billing and management solutions held the largest share in 2012 and is expected to be fastest growing segment owing to increasing demand for customized software tailored to specific needs of the restaurateurs.

QSRs are primarily known for their dynamic setting where orders are taken promptly, payment is made and food is handed over to customers in a short time. The payment mechanism is rapidly changing with the growth of restaurants designed on fast service models. Almost all significant digital changes in quick service restaurants are primarily driven by the growing need of clarity, speed, and accuracy in transactions.

Digital signage held the largest share of QSR ecosystem market. While some QSRs adopted for digital signage to keep customers occupied during rush, others use them to display menus. Over the past few years, the points of sale (PoS) devices have become more compact and efficient. With technological advances, new range of battery powered PoS devices offer wireless access to communication network for payment processing. On the other hand, many customers are interested in self service aspect of QSR. Self service kiosks are expected to grow at faster rate compared to POS devices over the forecast period as they improve accuracy, shorten perceived wait time and allow efficient workforce management.

The U.S QSR ecosystem market contain numerous players. Major industry participants include Keywest Technology Inc., Nanonation, Inc. NEC Display Solutions Ltd., Cisco System Inc., Hewlett-Packard Company, Omnivex Corporation, Panasonic Corporation, Samsung Electronics Co. Ltd., LG Display Co. Ltd., and REDYREF Inc. among others.

The report studies the U.S. QSR ecosystem market, and provides estimates and forecast in terms of revenue (USD Million) for the period 2012 to 2019. Market estimates are provided on the basis of component types. The market has been segmented as follows:

Browse the full U.S. Quick Service Restaurant Ecosystem Market report:

http://www.transparencymarketresearch.com/us-quick-service-restaurant-market.html
U.S. QSR Ecosystem Market, by Component
  • Hardware
  • Signage systems
  • Kiosks
  • Drive through terminals
  • Point of sales (POS)
  • Handheld devices
  • Digital menu cards

Software
  • Billing solutions and management solutions
  • Analytics software solutions (bid data analytics)

Services

Samsung to Set Up Another Smartphone Manufacturing Facility at Vietnam, Pumping US$3 billion into the Project


Samsung Electronics has decided to set up its latest smartphone manufacturing unit in Vietnam, pumping a whopping US$3 billion into the project. The company already owns a US$2 billion facility in Vietnam, which initiated operations in March this year.

In the last few years, a number of technology big wigs have set up manufacturing facilities in Vietnam, with Microsoft, LG, Panasonic, and Intel being some of them. These new investments flowing into Vietnam are increasingly contributing toward a shift from China to other Asian countries.

The greatest motivator for companies to zero in on Vietnam has been a favorable combination of cheap workforce and tax subsidies and holidays from the Vietnamese government. These benefits are better than Vietnam’s northern neighbor.

As the world’s second-largest economy, China’s success has also led to steep rises in the price of labor, land, and other resources. This has prompted many manufacturers to look beyond the Asian powerhouse.

The manufacturers in China, forced to operate on very tight margins, regard countries such as Vietnam to be more cost-effective.
At the same time, more and more Chinese companies are now graduating to design and software product development. In this situation, low-value and low-skill jobs leaving the country may not be that bad after all.

Vietnam is already firmly placing its name on the smartphone manufacturing map globally, as in the first 10 months of 2014 alone, the country exported mobile phones and accessories worth US$19.2 billion. This marks an 8% YoY growth, according to the Statistics Office at Vietnam.

Monday 10 November 2014

Malta’s Public Sector Employment Sees 4.5% Rise Since March 2013


Malta’s Principle Permanent Secretary Mario Cutajar came to the defense of the spike in the number of public sector employees saying that the education and health sector are in a phase of high growth in the island country. He said that in view of the rising public demand, there was a strong need to deploy more public sector workers in these two areas. According to Cutajar, it is important to immediately replace any vacancies in positions for teachers or nurses, as well as fill the new positions created as a result of the expanding health and education sector.

The local media has previously raised questions regarding the sudden rise in the number of public sector employees in the country. The NSO, in August 2014, had published statistics that showed a steep rise in the number of workers in the public sector in Malta. The Opposition parties said that nearly 1,900 new jobs had been added to the public sector in the very first year since the Labor Party came to power. This marks a 4.5% rise since March 2013.

However, according to Cutajar, the public sector in Malta is in need of renewal, and the focus is now being shifted toward reducing bureaucracy and in improving the client-focus of these units, when dealing with both internal and external clients. He also added that on account of these capacity expansions, there has been a marked improvement in the quality of public sector services being offered under the aegis of the Malta government.

Thursday 6 November 2014

Lithuania Becomes First European Country to Ban Energy Drinks to Under 18s


From November 1 this year, Lithuania has banned the sale of energy drinks to those aged under 18 years. This makes the country the first in the European region to do so. The decision to impose the ban was frozen in May 2014, and has now been definitively imposed across the country. On similar lines, yet another ban on energy drinks targeted at under 18s will also be imposed very soon in the Baltic state.

As per the specifics of the ban, any drink that contains 150 miligrams per liter of caffeine is considered as an energy drink. To put things in perspective, consider this: A 250ml can of Red Bull typically contains about 80 mg of caffeine.

Authorities were forced to consider this ban seriously after a 2013 study commissioned by the European Food Safety Authority commissioned revealed that in Europe, nearly 70% of energy drink sales could be attributed to teenagers. Lithuania, teenagers accounted for about 50% of the total sales of energy drinks.

However, energy drinks are not being regarded as a public health risk by the government. This is also the reason it hasn’t placed these beverages in the same category as alcohol and tobacco.

Government officials said that ample research has been done to prove that energy drinks could be detrimental to health – especially so for teenagers - and hence it became imperative for the government to take corrective measures.

Meanwhile, market watchers said that this ban will severely dent the energy drinks market in Lithuania, which in 2014 was valued at 26.4 million euro, according to Euromonitor.

Wednesday 5 November 2014

Europe Ambulatory Surgical and Emergency Center Services Market Expected to Reach USD 42.8 Billion in 2020


According to a new market report published by Transparency Market Research “Europe Ambulatory Surgical & Emergency Center Services Market - Industry Analysis, Size, Share, Growth, Trends and Forecast 2014 - 2020” the Europe ambulatory surgical and emergency center market was valued at USD 18.5 billion in 2013 and is expected to reach USD 42.8 billion by 2020, growing at a CAGR of 13.0% from 2014 to 2020.

Ambulatory surgery refers to planned diagnostic intervention that can be performed on a daily basis. The market of Europe ambulatory surgical and emergency center comprises different types of surgical procedures such as ophthalmology, pain management, gastrointestinal, orthopedic, dermatology, urology, obstetrics and vascular that can be done on ambulatory basis. The ambulatory surgery market in Europe is driven by factors such as rising geriatric population coupled with increasing incidences of cataract, varicose vein, hernia, illegal abortions and others. According to the 2013 European Commission report, around 17.8% of the European population were aged 65 years and above in 2012. The organization also stated that the percentage of aging population is expected to reach around 29.9% by 2050. Thereby, rising burden of cataract, hernia and other problems are also likely to increase with aging population which would boost the market of ambulatory surgical and emergency center services. Introduction of new technologies and growing penetration of minimally invasive surgeries will further stimulate the European ambulatory surgery market. Advancement in operative techniques and surgical instruments would enable more complex surgeries such as disc operation, retinal detachment, pars plana vitrectomy and others to be performed under ambulatory basis and hence would drive the market growth. These all factors collectively propel the need of ambulatory surgical services during the forecast period. However, lack of proper ambulatory facilities and unfavorable reimbursement schemes for ambulatory services would restrain the market growth in Europe.

The market of Europe ambulatory surgical and emergency analyzes both segments (i.e. types of procedures and geography) in terms of market revenue (USD Million) and market volume (number of procedures). The orthopedic surgeries segment accounted for the largest market share in 2013 owing to high cost of surgeries compared to other ambulatory surgeries. However, ophthalmology segment recorded the highest CAGR (in terms of market revenue) and highest number of procedures in terms of market volume. The high growth of ophthalmology surgery is attributed to growing number of ophthalmology surgeries coupled with rising incidences of vision problems such as cataract, diabetic retinopathy, glaucoma and others. For example, the Organisation for Economic Co-operation and Development (OECD) stated that the number of day surgeries performed for cataract is continuously increasing in Europe.

Browse the full Europe Ambulatory Surgical & Emergency Center Services Market:  

Geographically, Europe ambulatory surgical and emergency center services market is segmented as the U.K., Germany, France, Italy, Spain, Belgium and Rest of the Europe. The U.K. ambulatory surgical and emergency center market accounted for the largest share owing to rising government initiatives to promote ambulatory surgeries coupled with advancement in ambulatory surgical techniques. However, Rest of the Europe (RoE) recorded the highest number of ambulatory surgeries performed in 2013. Low cost for ambulatory surgeries as compared to other European countries coupled with rising trend of ambulatory surgeries in countries such as Netherlands, Sweden and others helps RoE to record high number of ambulatory surgical procedures. 

The market of Europe ambulatory surgical and emergency center services is majorly dominated by government hospitals. However, due to immense growth potential in this industry, private sector hospitals are expected to grow consistently in the near future. The key players having presence in the ambulatory surgical & emergency center services market include AmSurg Corporation, LCA – Vision, Inc., Symbion, Inc., Terveystalo Healthcare Oyj, Medical Facilities Corporation, Healthway Medical Corporation Ltd., Eifelhoehen-Klinik AG, Community Health Systems, Inc. and others.

The Europe ambulatory surgical and emergency center services market is segmented as follows:

Europe Ambulatory Surgical and Emergency Center Services Market, by Types of Procedures
  • Ophthalmology
  • Gastrointestinal
  • Pain Management
  • Orthopedics
  • Dermatology
  • ENT
  • Urology
  • Obstetrics
  • Vascular
  • General Surgery
  • Pulmonary
Europe Ambulatory Surgical and Emergency Center Services Market, by Country
  • U.K.
  • Germany
  • France
  • Italy
  • Spain
  • Belgium
  • Rest of the Europe (RoE)

Unilever U.S. Revamping Buttery Spreads Range


Unilever U.S. has recently stated that it is revamping its range of buttery spreads. The first product to undergo change will be I Can’t Believe It’s Not Butter! The recipe will now be based on ingredients such as plant-based oils and water, with the artificial preservatives being removed entirely. Following this, other products in the portfolio will be transformed starting 2015.

The company, one of the largest players in the consumer goods market, said that it is focusing more and more on how it can delivery balanced food products made using simple ingredients without compromising the nutritional value of foods. The company said that it is also laying greater emphasis on sustainable sourcing, and the latest product transformations will propel those efforts.

According to Unilever Foods, NA, VP Mike Faherty, the series of transformations will begin with I Can't Believe It's Not Butter!, and the company is positive that this will help boost sales of buttery spreads for the company. This product will be launched in November 2014, and will be applied to the company’s other buttery spreads brands such as Imperia, Brummel & Brown, and Country Crock later in 2015.

As consumers are increasingly wary of consuming butter with high amounts of hydrogenated fats, there has been a shift towards buttery spreads that are made using plant-based oils and other natural ingredients that are high in good cholesterol. The company seems to have spotted this gap, and is leading the transformation of buttery spreads into even healthier products that will likely be received by health conscious consumers.

Tuesday 4 November 2014

E-Clinical Solution Software Market is expected to reach USD 6,515.3 million in 2020

According to a new market report published by Transparency Market Research “E-Clinical Solution Software Market - Global Industry Analysis, Size, Share, Growth, Trends and Forecast, 2014 - 2020,” the global microfluidic device market was valued at USD 3,005 million in 2014 and is expected to grow at a CAGR of 13.8% from 2014 to 2020, to reach an estimated value of USD 6,515.3 million in 2020.

Globally, the e-clinical solution software market is witnessing significant growth due to increasing clinical trials and R&D investments in pharmaceuticals and life science. Increasing prevalence of diseases supports clinical trials in different regions. Various lifestyle associated diseases and genetic disorders in the Middle East and North African countries have also enhanced clinical trials in the respective regions. In addition, the pharmaceutical industry is facing immense pressure to reduce the time consumed during clinical trials and to raise the productivity of drugs. Presence of various end users such as pharmaceuticals, clinical research organizations (CRO) and healthcare providers has increased the acceptance of e-clinical solution software. The global e-clinical solution software market is estimated at USD 3,005 million in 2014. It is likely to grow at a CAGR of 13.8% from 2014 to 2020 to reach USD 6,515.3 million in 2020.

North America is a traditional clinical trial region. The average cost of pharmaceutical research and development for a successful drug continues to increase from pre-clinical stage i.e. initial development stage of drug till FDA approval i.e. drug is launched in market. According to Oracle Corporation, an e-clinical software company, the percentage share of global clinical trials conducted in North America has reduced from 30% in 2006 to 19% in 2010. This was due to regulatory and legal considerations, which shifted the clinical trial market from North America to developing countries such as India and China. This may lead to sluggish growth of clinical trials in the region.

In Europe, Countries in Central and Eastern Europe provide abundant opportunities to life science companies for clinical development. According to Oracle Corporation, the percentage of clinical trials conducted in Western Europe has decreased from 25% to 19% and in Eastern Europe, the percentage has increased from 10% to 13% during 2006-2010. Similarly, according to the U.S. National Institutes of Health (Clinical Trial government registry), the clinical trials conducted in Europe were 46,192 in May 2014.

However, Asia has become one of the fastest-growing markets for pharmaceutical products. Improved industry regulatory laws and patent expiration laws in various countries including Japan, China and India, have led to the expansion of the clinical trials market in Asia. Asia has lower cost of conducting clinical trials compared to Europe or the U.S.

Oracle Corporation, Medidata Solutions, PAREXEL International Corporation, BioClinica, OmniComm Systems and others are the major players of e-clinical solution software market.

Browse Full E-Clinical Solution Software Market Research Report With Complete TOC:  
http://www.transparencymarketresearch.com/e-clinical-solution-software-market.html

The e-clinical solution software market is segmented as follows:

E-Clinical Solution Software Market, By Mode of Delivery
  • Web based e-clinical solution software
  • Licensed Enterprise e-clinical solution software
  • Cloud based e-clinical solution software
E-Clinical Solution Software Market, By Products
  • Clinical Data Management
  • Clinical Trial Management System
  • Electronic Clinical Outcome Assessment Solution
  • Randomization and Trial Supply Management
  • Safety Solution
E-Clinical Solution Software Market, By End Users
  • Pharmaceutical
  • Clinical Research Organizations
  • Healthcare Providers
E-Clinical Solution Software Market, by Geography
  • North America
  • U.S.
  • Europe
  • Germany
  • France
  • U.K.
  • Italy
  • Spain
  • Poland
  • Russia
  • Asia
  • China
  • South Korea
  • Taiwan
  • India
  • Rest of the World (Row)

Massive Public Sector Projects to Gain Speed as Saudi Arabia Makes Contracting Easier


The Saudi Arabian government is on track to implement what could easily be among the most ambitious programs for an infrastructure upgrade. The Riyadh Metro, pegged at US$20 billion, is among the highlights of this massive infrastructure overhaul. Despite this, international contractors have been unable to access the market because of certain barriers to bidding for public sector projects, and the costs associated with the same.

To change these perceived barriers, the Saudi Arabian government has now announced a slew of programs that will make it easier for international contractors to pump money into this lucrative opportunity. The most noticeable among these will be the Saudi Arabian council of minister easing the stringent requirements under the Government Tenders & Procurement Law.

Since Saudi Arabia earned membership of the Trade Organisation in 2005, its markets have been officially open to international contractors for investments. In fact, Saudi Arabia is among the handful of countries in the MENA region that allows 100% ownership in local establishments by foreign companies. While these factors did create a favorable atmosphere for foreign companies, the country also has numerous licenses and certificates that international contractors need to procure. This, according to market analysts, was posing the biggest impediment to international contractors wanting to foray into the Saudi Arabian public sector. Non-compliance with the stringent rules in Saudi Arabia could potentially mean blacklisting, heavy fines, or even imprisonment.

Given that the country is now investing heavily in metros, healthcare projects, airport expansions and infrastructure projects, the need for foreign technology has been more pressing now than ever for the country.

While market experts are calling the easing of laws a progressive step, it remains to be seen whether the changes are able to bring in tangible results.

Monday 3 November 2014

HP Makes Much-Awaited Foray into the 3D Printing Space


Hewlett-Packard, a company that is best known for its expertise with printers, is taking a step ahead into the 3D printing domain. Industry watchers often expressed surprise that the company, until now, had not made a foray into the emerging fields of 2D and 3D printing technology. However, this is set to change as HP makes a move towards this increasingly lucrative industry segment.

HP recently announced that it will be unveiling its debutant 3D printing come 2016. According to the company, its presence in the 3D printing domain will likely lead this space to grow at a faster pace, besides heating up the competition dynamics. HP top bosses are confident that the company will contribute tangibly to 3D printing technology by bringing down the price of operation.

The company’s 3D printing operations will be initially targeted at enterprises – a market entry model that’s similar to its strategy for large format printers that print billboards and large posters. The 3D printers are likely to be employed for printing industrial components and other practical objects. Experts opine that with HP making foray into the 3D printing space, other companies will be forced to look at making their offerings more competitive and of better quality.

According to industry watchers, HP’s entry in the 3D printing segment is looking like a welcome development as the prices of products will become more affordable, while quality will rise many notches higher.

Since 3D printing hit the commercial space back in 2009, thanks to MakerBot, competition has been intensifying every year with new players announcing their expansion into this domain.